
Infographic Design

Infographic Design Services in Delhi NCR

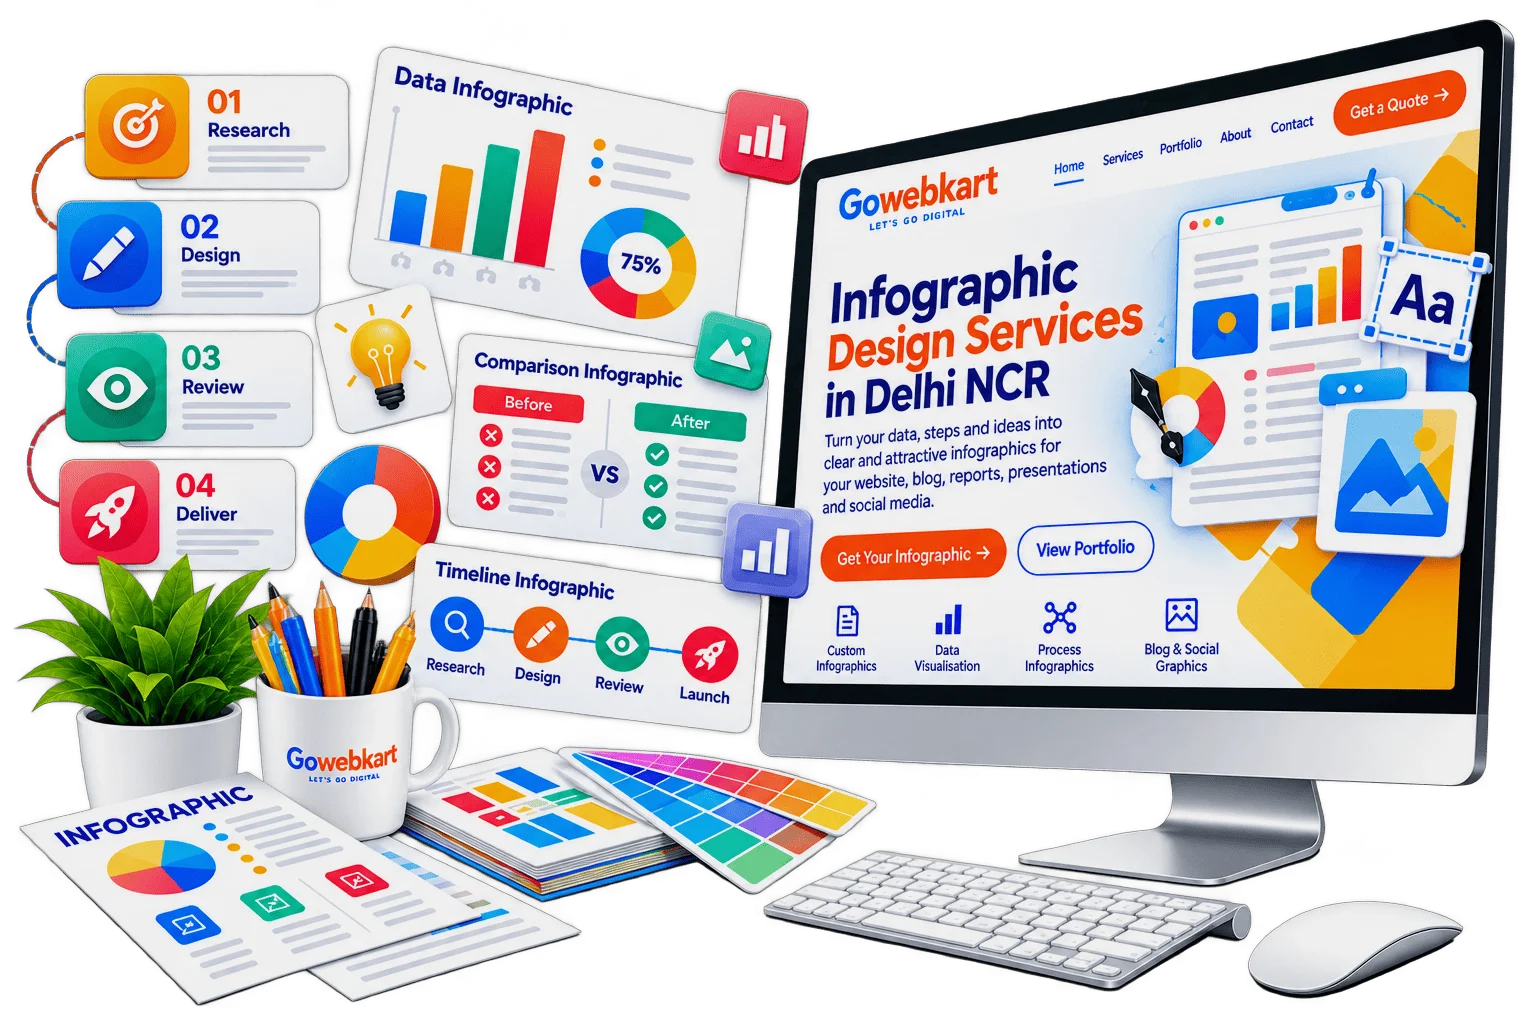
People skim long paragraphs but stop for a clear picture. Gowebkart designs infographics that explain numbers, steps, comparisons and timelines at a glance, for your website, blog, reports, presentations and social media, while keeping your brand colours and the facts accurate.

Infographic design by Gowebkart

Infographic types

Infographics We Design

The layout is chosen to suit the story your information needs to tell.

  • Statistical Infographics

    Charts and figures that make survey or sales data easy to grasp.

  • Process Infographics

    Step-by-step flows that explain how something works.

  • Timeline Infographics

    Company history, project plans or event schedules on one line.

  • Comparison Infographics

    Side-by-side views of plans, products or options.

  • Social Media Infographics

    Carousel-friendly versions sized for Instagram and LinkedIn.

  • Report Graphics

    Charts and callouts for annual reports and presentations.

Clear and Correct

Simple Visuals Built on Accurate Information

A good infographic has one main message, a logical reading order and only the numbers that matter. We work from your data or content, choose the right chart for each point, label it clearly and check every figure against the source you give us, so the graphic is easy to understand and safe to share.

Illustration of content and information being organised

How we work

Our Infographic Design Process, Step by Step

Accuracy comes first, then layout, so the final graphic is both easy to read and correct.

  1. Share Data & Purpose

    You send the data, report, survey results or draft content, plus where the infographic will appear: a blog, a LinkedIn carousel, a slide or a printed report. We agree who will read it and the one main message they should remember.

  2. Shape the Story

    We sort your content into a clear reading order and suggest dropping what does not support the main point. Each number gets the chart that suits it: bars for comparisons, lines for trends, a timeline for dates, a flow for steps. You approve this layout plan first.

  3. Design & Check Figures

    We design the infographic in your brand colours and fonts, with clear charts, icons and short labels. Before you see it, we check every figure, percentage and date against your source. You then review it and tell us what to change.

  4. Size for Each Platform

    Once approved, we export the versions you need: a long PNG or SVG for your website, slides for a social media carousel, a presentation slide or a high-resolution PDF for print. You also get the source file (CDR or PSD) of the design.

Let’s talk

Have Information That Is Hard to Explain?

Send us your data or content, and we will turn it into a clear visual.

Share the information, where the infographic will be used and your brand files. We will propose a layout and share the price.

Call for a free consultation

+91 99992 79077Or Contact Us

Explore more

More Website Graphics Design Services

Reviews

See what our customers think

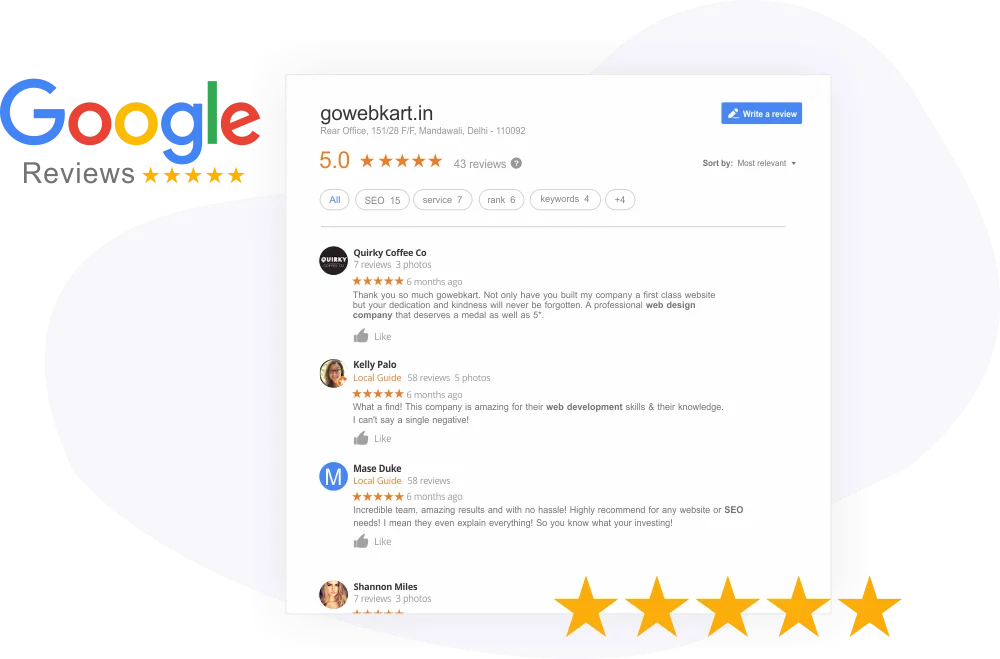
The website design looks very good and professional. The overall layout, appearance, and presentation are excellent. Great work!

PSS RaoView review on Google
Review 1 of 20
Write a Review
Gowebkart customer reviews on Google

FAQ

Infographic Design FAQs

An infographic is a visual that combines charts, icons, short text and illustrations to explain information quickly and clearly.

On your website and blog, in reports and presentations, in brochures and on social media platforms such as Instagram and LinkedIn.

Yes. You share the data or content, and we organise and design it. We check the figures against your source but do not create statistics.

Yes. We can adapt one infographic into a long web version, a slide and a social media carousel.

An infographic works best with very little text: a short heading, clear labels and one or two lines per point. The charts and icons should carry the message, and longer explanation can sit in the blog post or report around it. We help shorten your text without changing its meaning.

Yes, we can update the figures, dates and charts whenever you send new data. We work on the same design, so a new set of numbers or an extra step does not need a fresh design, and the look stays the same.

It depends on the amount of information and the number of versions. Share your content for an estimate, or call our team on +91 99992 79077.